

Visualize This: The FlowingData Guide to Design, Visualization, and Statistics (Paperback)
Product description
For readers who want to bring design, data visualization, and statistics into the same conversation, Visualize This offers a guide focused on all three. Its subject matter makes it relevant when you are thinking about how to present or interpret data. How do the visual choices and the statistical perspective fit together? The book’s title puts that combination at the centre.
Best use cases
This book suits readers exploring data visualization alongside its design and statistical context. It can be a useful reference point when planning a chart, preparing a data-led presentation, or deciding how to make information easier to follow. Rather than approaching visualization as a purely decorative task, readers can engage with it as a topic connected to both design and statistics, as signalled by the book’s full title.
For example, someone organizing data for a report may want to consider not only what the figures say, but also how their presentation shapes the reader’s understanding. A guide that brings visualization, design, and statistics together is pertinent to that broader question. It also speaks to readers whose interest crosses subject areas, rather than focusing on design or statistics alone.
What stands out
The book’s defining distinction is its combined focus: design, visualization, and statistics appear together in the subtitle, under the FlowingData name. That makes it a natural fit for readers looking for a resource at the intersection of these subjects, rather than a book identified solely as a statistics text or a design title. The paperback format offers a physical edition for reading at a desk or keeping with other reference books.
Its scope is signalled clearly before you begin: the subject is data visualization, considered through both design and statistical perspectives. This gives prospective readers a straightforward way to judge whether the topic matches their interests, whether they are learning about the field or returning to it while working on a data-related task.
The essentials
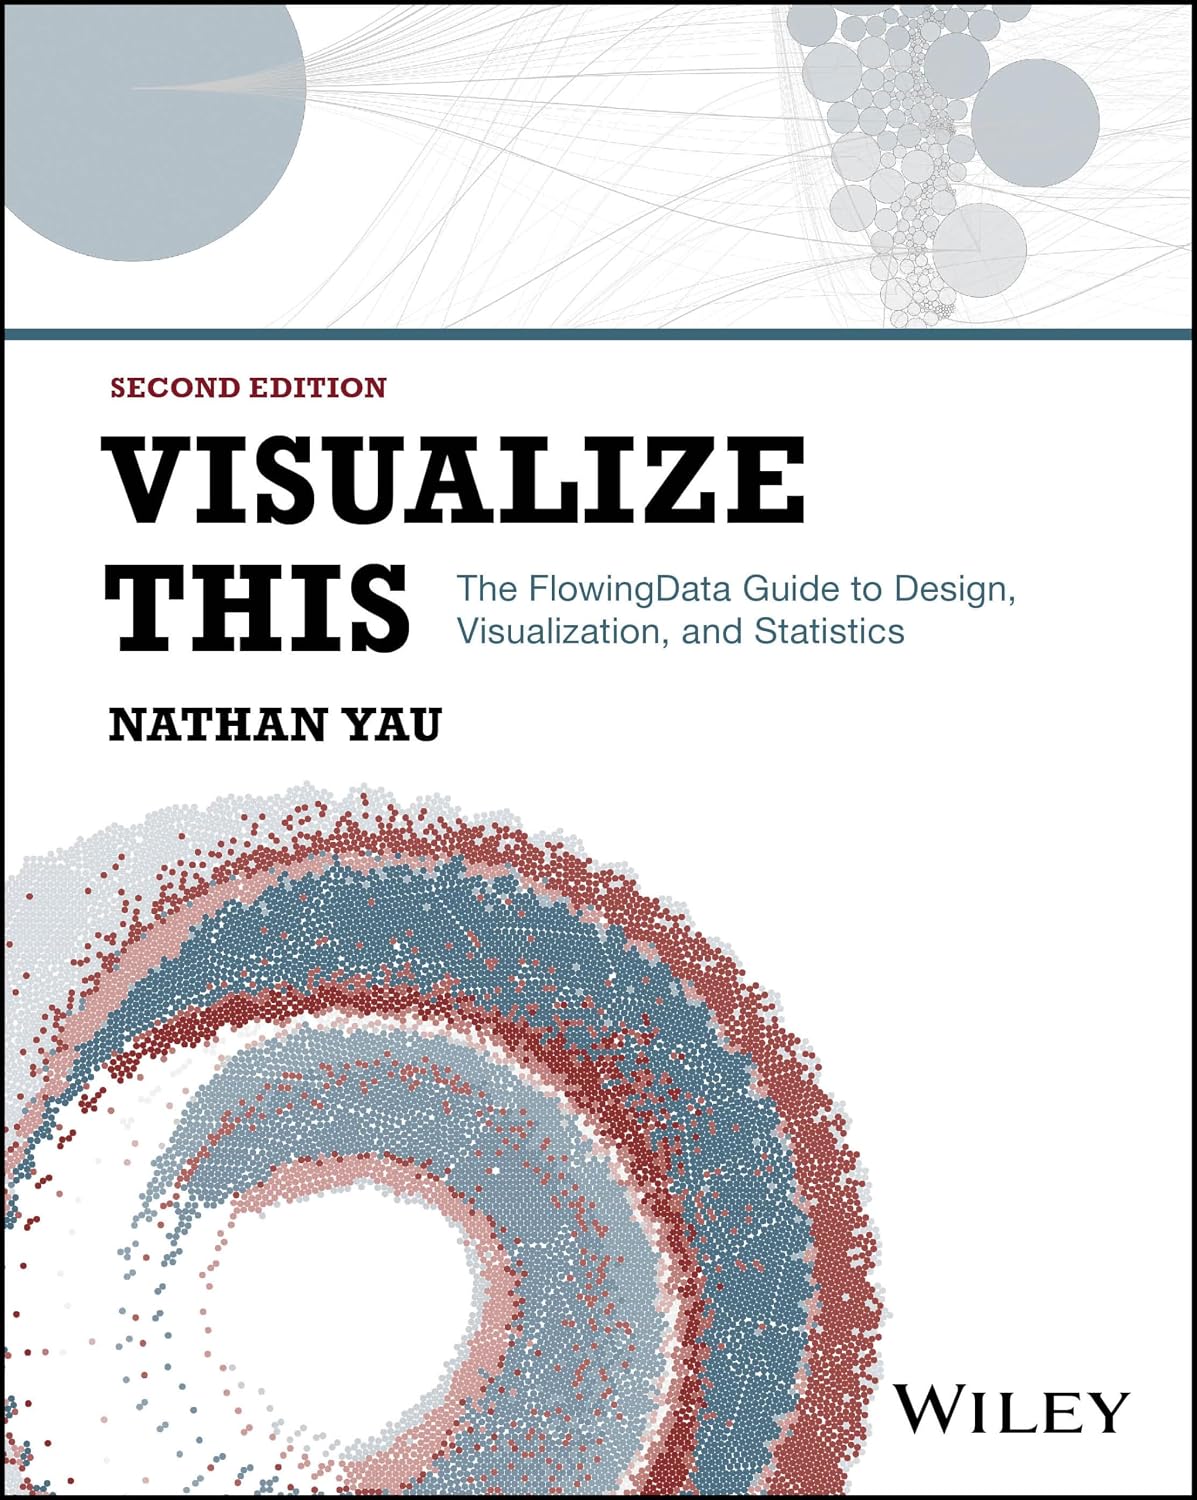
- Title: Visualize This: The FlowingData Guide to Design, Visualization, and Statistics
- Author: Nathan Yau
- Format: Paperback
- Publication date: May 29, 2024
- Dimensions: 18.54 x 2.03 x 23.37 cm
The stated dimensions can help when you are choosing space on a bookshelf or deciding how to store the book alongside other study materials. Its paperback format is also a practical detail for readers selecting a print edition. It suits you if you want a book whose stated subject connects the visual presentation of data with design and statistics.
Questions before you buy
What topics does the book cover? The title describes it as a guide to design, visualization, and statistics, with data visualization at the centre of that combination.
Who is the author? The book is by Nathan Yau, identified as the author in the product listing.
What format is this edition? It is a paperback edition. The listed dimensions are 18.54 x 2.03 x 23.37 cm, which may help you plan where to keep it.
Final verdict
Visualize This is suited to readers seeking a print guide that connects data visualization with design and statistics. Its clearly stated subject makes it a relevant choice for exploring how these areas relate when working with or presenting data, while the paperback format provides a physical edition for reading and reference.